3D Modeling and Visualization Solution for Gas Pipeline Networks
1. Project Background
With the development of cities, the scale of gas pipeline networks is becoming increasingly large and their layout more complex. Traditional management methods struggle to meet the needs of real-time monitoring, precise operation and maintenance, and efficient emergency response. Digital twin technology, by constructing virtual models that highly map to real gas pipeline networks, can provide comprehensive, real-time, and accurate data support for pipeline network management, improving management efficiency and safety.
2. Modeling Objectives
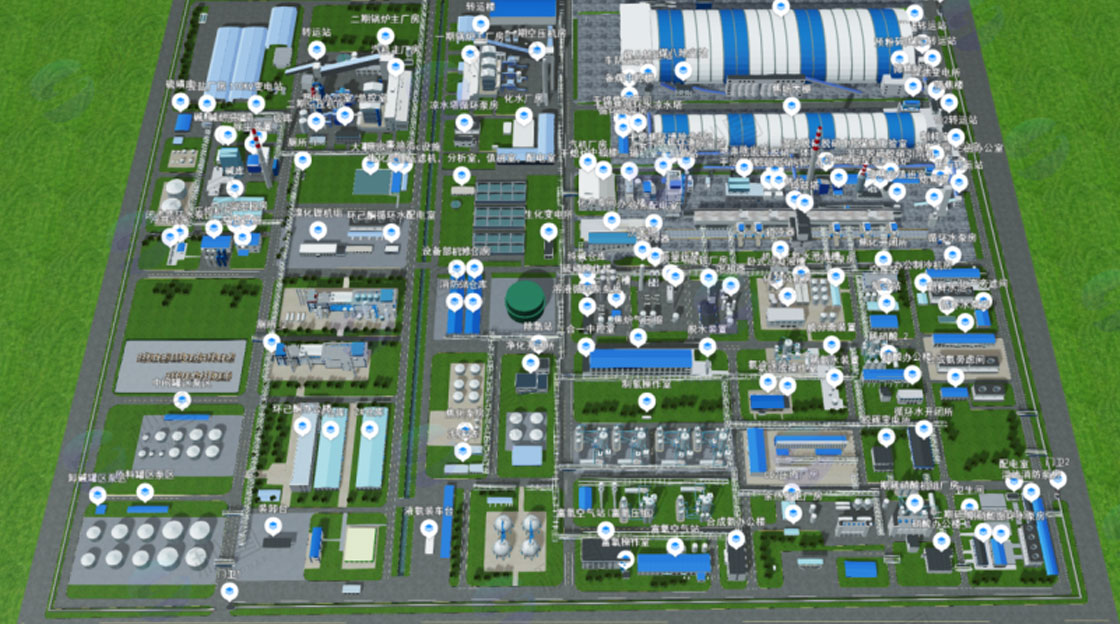
Build a high-precision 3D visualization model of the gas pipeline network to intuitively present the pipeline layout, facility locations, and topological relationships.
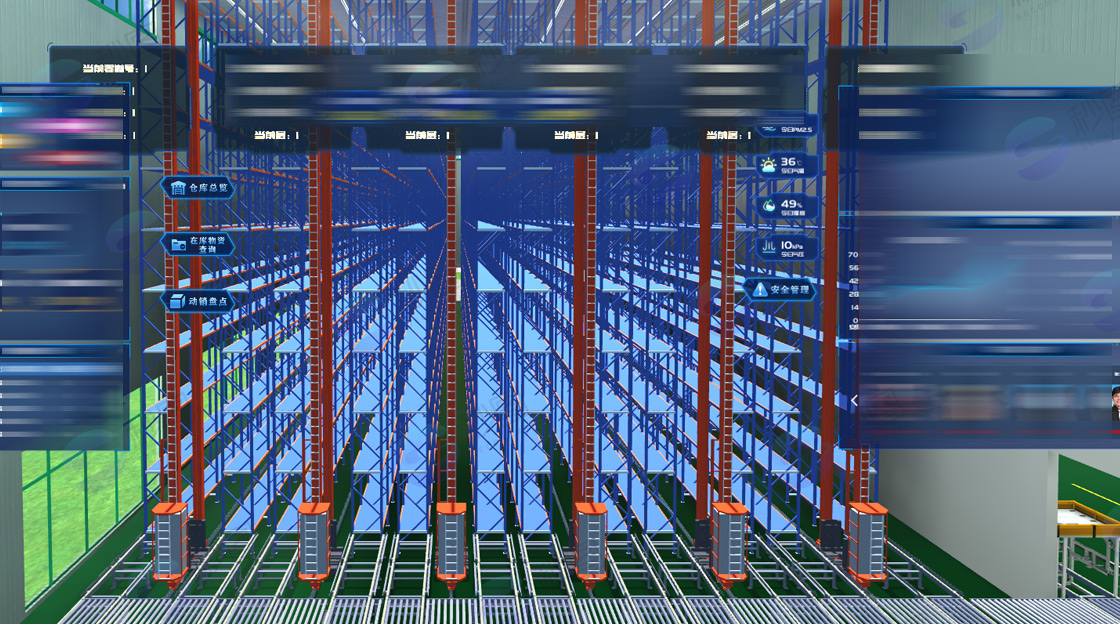
Achieve real-time data and model integration, dynamically simulate the operating status of the pipeline network, and provide a basis for operational decision-making.
Use the model for fault prediction and analysis, optimize maintenance plans, and reduce accident risks.
3. Data Collection and Processing
(1) Data Types
| Spatial Data | Geometric information such as planar position, burial depth, and pipe diameter of gas pipelines can be obtained through total station measurement, GPS positioning, and underground pipeline detectors. The location and geometric dimensions of pipeline network ancillary facilities (valves, pressure regulating stations, meters, etc.) are determined by combining field measurements with design drawings. |
| Attribute Data | Pipeline attributes such as pipe material, pressure rating, service life, and transport medium are collected from pipeline network archives and operation records. Facility attributes such as equipment model, specifications, and operating parameters are obtained through equipment nameplates and manufacturer data. |
| Real-time Operating Data | Pipeline operating parameters such as pressure, flow rate, and temperature are collected in real-time through sensors distributed at key nodes of the pipeline network, and aggregated to the data center via wireless transmission or wired networks. Equipment status (valve on/off status, pump operating status, etc.) is uploaded to the system by the status monitoring modules built into intelligent devices. |
(2) Data Processing
Perform coordinate transformation and projection settings on the collected spatial data, unify them to the urban geographic coordinate system, and eliminate data deviations.
Use data cleaning algorithms to remove errors, duplicates, and missing values in attribute data, ensuring data accuracy and completeness.
Establish real-time data access interfaces, perform filtering and noise reduction processing on sensor data to ensure data quality, and store it in the database according to time series for subsequent analysis and model driving.
4. Model Construction Process
(1) Basic Terrain Modeling
Collect urban terrain data, such as Digital Elevation Models (DEM) and Digital Orthophoto Maps (DOM).
Import DEM data into 3D GIS software to generate terrain surfaces, overlay DOM imagery to give the terrain realistic textures and colors, and construct a realistic urban terrain foundation.
(2) Gas Pipeline Modeling
Import the cleaned pipeline spatial data into modeling software, use line element drawing functions, and construct the pipeline network skeleton based on pipeline coordinates and directions.
Based on attribute information such as pipe diameter and burial depth, generate 3D pipeline models with real dimensions through modeling operations such as extrusion and lofting, and assign different materials and colors according to pipe material categories to enhance model recognizability.
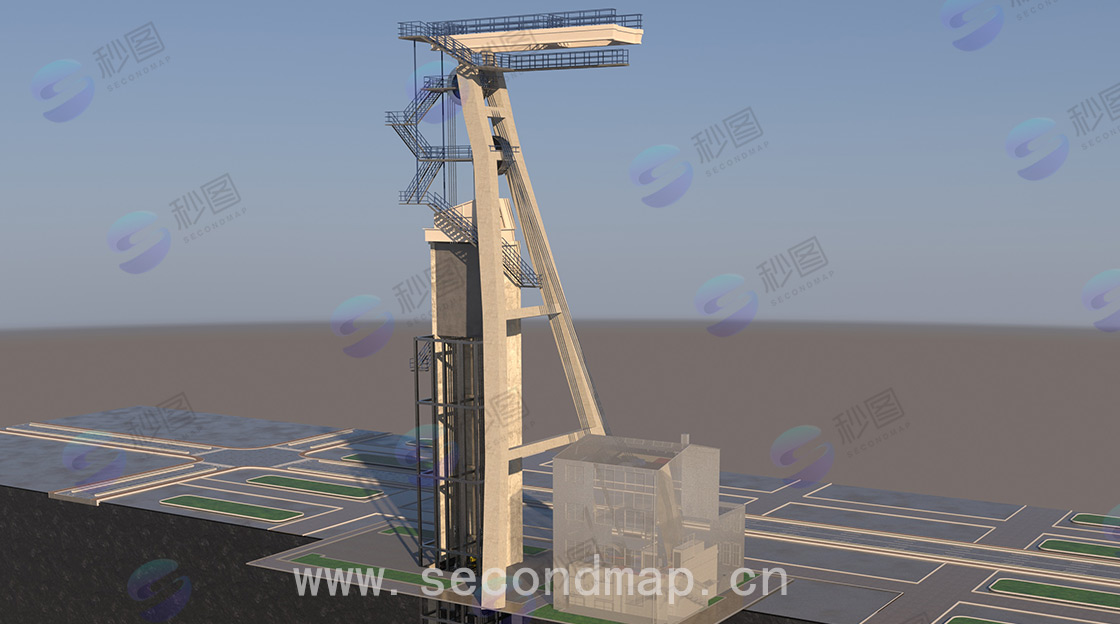
(3) Facility Modeling
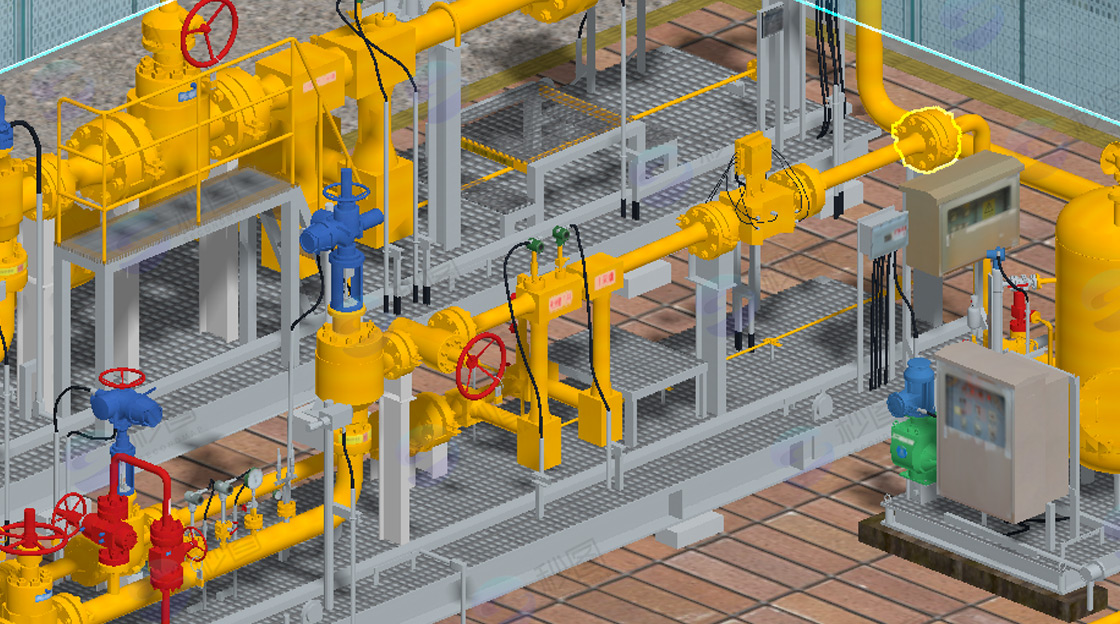
For ancillary facilities such as valves, pressure regulating stations, and meters, perform detailed modeling in SketchUp based on equipment dimensions and structure to build a 3D model library for each facility.
Import the facility models from the model library into the pipeline network model scene, accurately place them according to actual positions and directions, ensure correct connection relationships with pipelines, and refine the pipeline network model details.
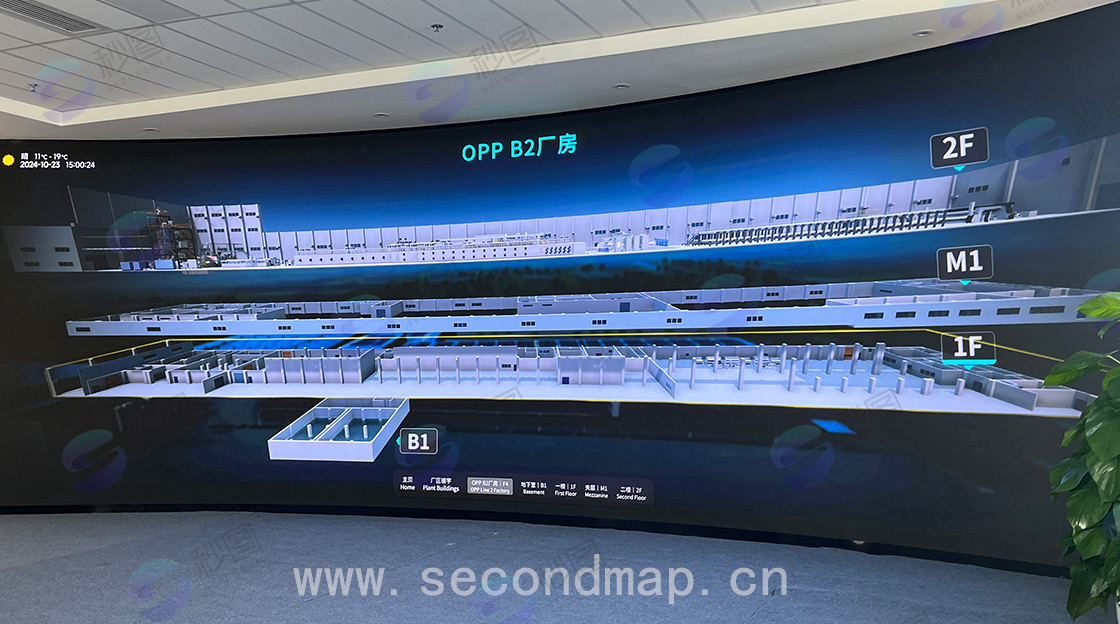
(4) Model Integration and Optimization
Integrate terrain, pipeline, and facility models in 3D GIS software, check the topological relationships between models, and ensure model continuity and accuracy.
Use model simplification algorithms to reduce the number of model faces and optimize model structure, improving model rendering efficiency and operational performance without affecting model accuracy. At the same time, add lighting and shadow effects to enhance the visual effect of the model.
5. Project Implementation Plan
(1) Phase 1: Project Preparation ([Preparation Time Period 1])
Form a project team including data collection personnel, modeling engineers, software developers, etc.
Conduct requirement research to clarify project goals and functional requirements.
Collect basic data required for the project, such as terrain data and pipeline network drawings.
(2) Phase 2: Data Collection and Processing ([Preparation Time Period 2])
Conduct gas pipeline network spatial, attribute, and real-time data collection work according to the data collection plan.
Clean, convert, and store the collected data to establish a data warehouse.
(3) Phase 3: 3D Modeling ([Preparation Time Period 3])
Complete basic terrain modeling and gas pipeline modeling.
Build pipeline network ancillary facility models and integrate and optimize them with pipeline models.
(4) Phase 4: Data Fusion and Function Development ([Preparation Time Period 4])
Achieve integration of real-time data and 3D models, and develop model application function modules.
Test the system and fix vulnerabilities and issues.
(5) Phase 5: Project Acceptance and Delivery ([Preparation Time Period 5])
Organize project acceptance and invite relevant experts and users to evaluate the project results.
Rectify and improve according to acceptance feedback, and deliver project results including 3D models, software systems, and related documentation.
6. Project Budget
Data collection costs: Including surveying equipment rental, personnel labor, etc., estimated at [X] million yuan.
Software licensing costs: Licensing fees for 3D GIS software, modeling software, etc., estimated at [X] million yuan.
Hardware equipment costs: Procurement of servers, data collection terminals, and other hardware, estimated at [X] million yuan.
Personnel salaries: Project team personnel salary expenses, estimated at [X] million yuan.
Other costs: Such as office space rental, travel expenses, etc., estimated at [X] million yuan.
The total budget is approximately [X] million yuan, and specific costs can be adjusted according to actual project conditions.
7. Project Risks and Response Measures
Data quality risk: Inaccurate or incomplete data collection may affect model accuracy. Response measures: Strengthen data collection personnel training, use multiple data collection methods for mutual verification, and establish a strict data quality review mechanism.
Technical difficulty risk: Technical issues such as complex terrain modeling and model real-time rendering performance may be encountered during the modeling process. Response measures: Organize technical teams for technical breakthroughs, draw on relevant project experience, and invite external experts for guidance when necessary.
Project schedule risk: Project delays due to difficulties in data acquisition, technical issues, etc. Response measures: Develop detailed project schedules, regularly track and adjust project progress, reasonably allocate resources, and proactively estimate and resolve issues that may affect progress.